
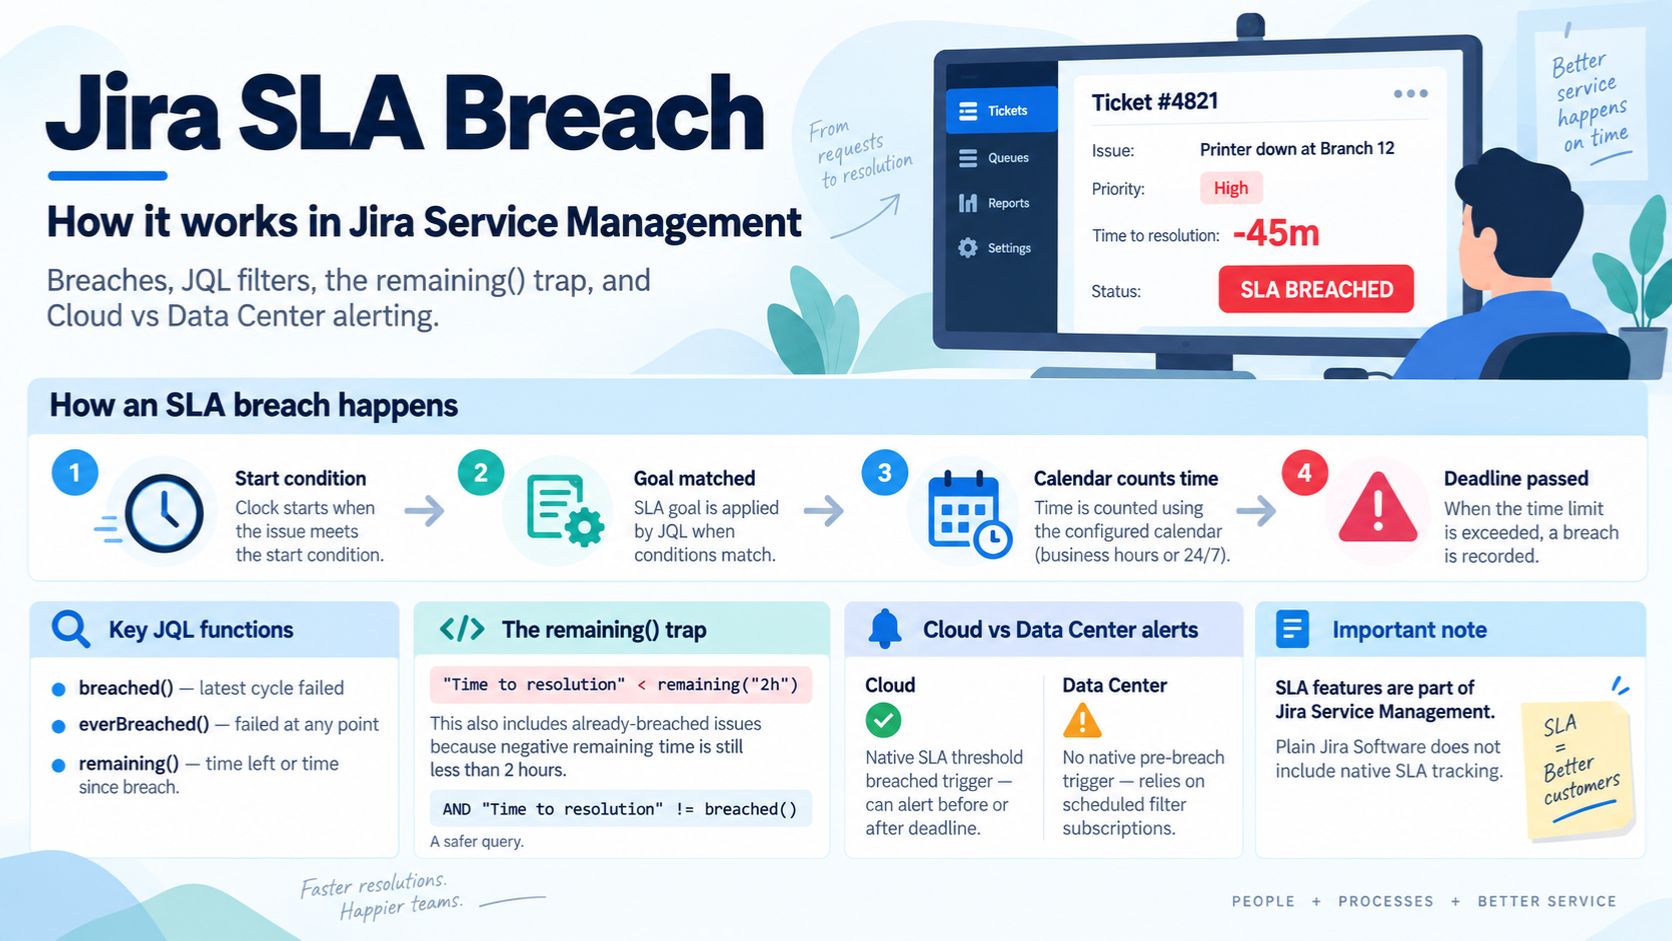
Jira’s SLA engine is more capable than most teams use and more conditional than most teams expect. Nearly every “our SLAs are wrong” complaint turns out to be a condition that never matched, a goal that never applied, or a JQL function that quietly returns more than you asked for.
A Jira SLA breach happens when a work item passes the goal set for one of its SLA time metrics in Jira Service Management. Plain Jira Software has no SLA feature at all. You find breaches with the JQL functions breached() and everBreached(), and you get alerted through the SLA threshold breached automation trigger — which fires before or after the deadline on Cloud, but does not exist natively on Data Center.
SLAs Are a Jira Service Management Feature
This is the first thing to settle, because a large share of people searching for Jira SLA breaches are working in the wrong product. SLA goals, SLA calendars and the SLA JQL functions all live in Jira Service Management. Jira Software has no native SLA tracking — teams there either move the queue into JSM or add a marketplace app that reimplements the clock.
If you cannot find an SLA section in project settings, that is usually the answer rather than a permissions problem.
How Jira Decides a Work Item Has Breached
An SLA in JSM is not a single deadline. It is four separate pieces of configuration, and a breach is what happens when they combine badly:
| Part | What it controls |
|---|---|
| Time metric | What is being measured, such as Time to first response or Time to resolution. |
| Start, pause and stop conditions | Which events begin the clock, suspend it and end it. Pause is typically bound to a waiting-for-customer status. |
| Goals | The actual targets. Each goal is matched by a JQL query, so different priorities or request types get different deadlines. |
| Calendar | Which hours count. A 24/7 calendar on a business-hours team breaches every night by construction. |
The consequential detail is that goals are matched by JQL, in order. A work item takes the first goal whose query it satisfies. If it satisfies none, no goal applies and no clock runs — the SLA simply shows nothing rather than warning you. An SLA that is mysteriously blank on new tickets is almost always this, not a bug.
Finding Breaches with JQL
JSM exposes a set of SLA-specific JQL functions. These are the ones that matter:
| Function | What it returns |
|---|---|
breached() |
Items whose last SLA cycle failed to meet its goal. |
everBreached() |
Items that have failed a goal at any point. |
running() |
Items whose clock is currently ticking, with no stop event reached. |
paused() |
Items whose clock is suspended by a pause condition. |
completed() |
Items that have reached a stop event. |
elapsed() |
Time since the current cycle’s start event. |
remaining() |
Time relative to the goal. Positive is time left; negative is time since breach. |
The remaining() Trap
This one catches almost everybody. The obvious query for “what is about to breach” looks like this:
"Time to resolution" < remaining("2h")
It does find everything due within two hours. It also returns everything that has already breached, because negative values are still less than two hours. Atlassian documents this explicitly: remaining() includes both unbreached and breached items.
So a dashboard built on that query shows a number that only ever grows, mixing live urgency with historical failure. To get genuinely at-risk work only, exclude the breached set:
"Time to resolution" < remaining("2h") AND "Time to resolution" != breached()
The same logic in reverse finds what broke recently — <= remaining("0m") AND > remaining("-60m") returns items that breached within the last hour, which is the right basis for an escalation queue.
breached() Is Not everBreached()
Metrics like Time to first response can run more than once on a single work item when a conversation reopens. breached() looks only at the most recent cycle; everBreached() looks at the whole history.
Report on the wrong one and the numbers diverge in a way nobody can reconcile in a meeting. For live triage, breached() is correct — you care about the current state. For monthly service reporting, everBreached() is almost always what was actually promised.
Getting Alerted: Cloud and Data Center Are Different
On Cloud, automation includes an SLA threshold breached trigger. Atlassian describes it as running when an SLA has breached or is about to breach, and it lets you pick the SLA to watch and the amount of time before or after the deadline to fire. That is native pre-breach alerting with a configurable offset, and it is the right tool for the job.
On Data Center, that trigger is not available. Atlassian’s own guidance states there is currently no functionality for custom pre-breach thresholds, and recommends building it from a saved JQL filter plus a filter subscription on a cron schedule — one per SLA. There is an open feature request, JSDSERVER-2003, to make it native.
The practical consequence: if you are on Data Center, your warning arrives on whatever interval you scheduled the subscription for, not at the threshold. For a resolution target measured in days that is fine. For a 15-minute first-response target it is not, and no amount of configuration fixes it — the same scheduled-rather-than-immediate constraint that limits SLA breach alerting in Zendesk.
Why JSM SLAs Go Wrong
In rough order of how often each turns out to be the cause:
- No goal matched. The goal JQL does not cover the request type or priority, so no clock ever started.
- The start condition never fired. The SLA begins on an event the workflow does not actually produce.
- The pause condition is too broad. A generous waiting-for-customer rule means the clock is stopped far more than anyone realises, and the reported time bears no relation to how long the customer waited.
- The calendar is wrong. Business-hours work measured against a 24/7 calendar breaches overnight, every night.
- Goal order. Goals are evaluated in sequence and the first match wins, so a broad catch-all placed above a specific rule silently swallows it.
None of these are speed problems, which is the general pattern with SLA breaches in any ticketing system: the configuration is usually wrong before the team is slow.
In Short
Jira Service Management gives you a genuinely flexible SLA engine, and the flexibility is where it bites. Check that a goal actually matches before trusting a clock, keep breached() and everBreached() straight in reporting, and never build an at-risk view on a bare remaining() query. If you are on Cloud, use the SLA threshold breached trigger rather than rebuilding it; if you are on Data Center, know that pre-breach warnings are scheduled rather than immediate.
Where InfraCue Fits
Full disclosure: this guide is published by InfraCue, so treat this as positioning rather than a neutral recommendation. Jira Service Management is the most configurable service desk of the three in this series, and if your team has the appetite to model SLAs in JQL, that flexibility is a real strength. The cost is setup time and exactly the class of misconfiguration described above — goals that never match, clocks that never start.
InfraCue trades configurability for an opinionated setup: SLA targets by priority and category, device health from Network Pulse sitting beside the tickets it caused, asset records, spares inventory and a NOC wallboard in one console, with locations as a first-class dimension. Pricing is in INR from ₹2,999 per month with a 30-day trial and no credit card.
This guide is maintained by InfraCue, an IT operations platform with ticketing, SLA tracking and device monitoring in one console. It documents Jira Service Management behaviour as described in Atlassian’s own documentation and is not affiliated with Atlassian.